In this context of minimum wage, the demand and supply framework is involved, where the demand of wages and the supply of workers are taken into consideration.
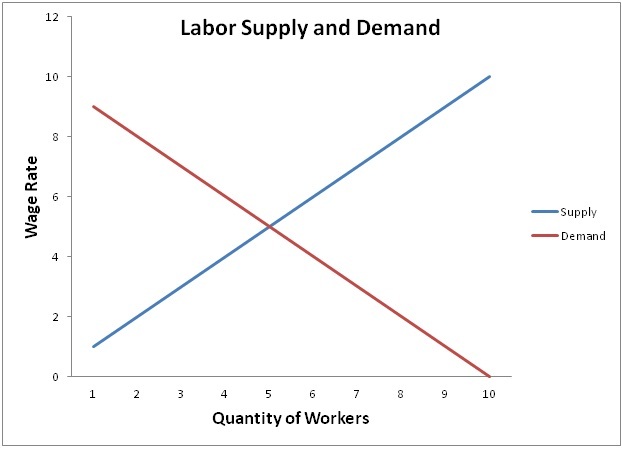
The diagram above shows a regular supply and demand curve when applied to labor and wage rates. For example, at a wage rate of $1/hour, the producer would be able to hire 9 workers. However, only 1 worker is willing to work at that wage, as demonstrated by the blue supply curve. This creates a shortage of workers. Alternatively, at $9/hour, the employer would only be able to hire 1 worker even though there are 9 workers who are willing to work at that wage. This creates a surplus supply of workers, thus resulting in unemployment. For this graph, the equilibrium rate is at $5/hour where the blue supply curve meets the red demand curve.
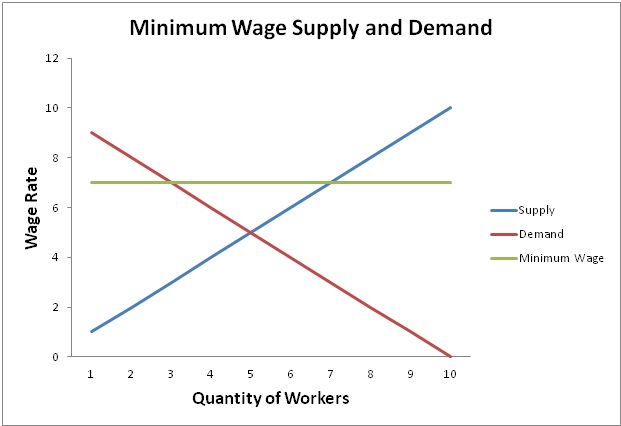
If a price floor (minimum wage) were to be introduced at $7/hour as illustrated by the green horizontal line in the diagram above. At that particular wage, the employer would be able to hire 3 workers while there would be 7 workers who would be willing to work at that wage. As a result, 4 surplus workers would be unemployed. In a free market, the employer can choose to hire more workers by lowering the wage rate down to $5/hr. However, since the minimum wage system is managed by the government, businesses have no choice but to increase their labour costs while hiring fewer workers.
